Posts

Showing posts from February, 2020

Module 6: Proportional Symbol and Bivariate Choropleth Mapping
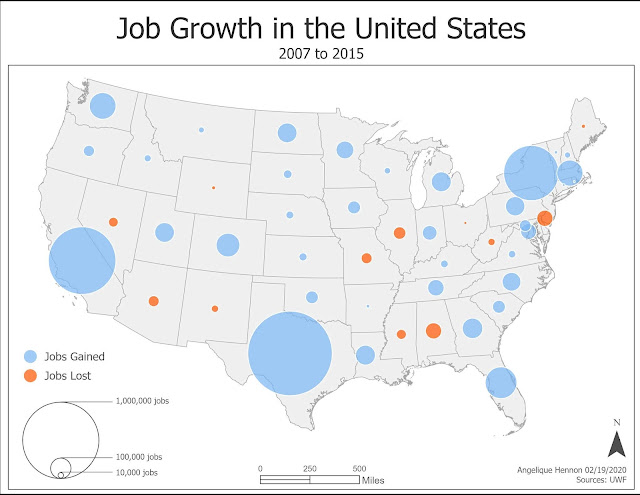
Image
The objectives of this week's lab was to explore proportional symbol and bivariate choropleth mapping techniques, as well as customizing legends for each technique. One of the data sets for this lab included positive and negative values. The final map utilizes proportional symbols to show both positive and negative values. This map is essentially two proportional symbol maps overlaid on each other, one for positive job growth and another for negative job growth, with the symbols for both variables sized the same. Utilizing proportional symbols to show both positive and negative values is an effective way to visualize areas that show the greatest and lowest values. These areas are easy to see quickly on the map and give the map reader a simple way to visualize the variable being mapped. Fig 1. Proportional symbol map using positive and negative values.  Another data set for this lab examined contained two data variables: percent of the US population in each state that is obe...

Module 5: Analytical Data

Image
The purpose of this week's lab was to practice using a number of different data visualization techniques to combine maps and graphics on an infographic. I chose to show the relationship between food insecurity and obesity based on 2018 data from the County Health Rankings National Data. Food insecurity is being without reliable access to sufficient quantities of affordable, nutritious food. Without access to affordable, nutritious foods, households often have to choose between amount or quality of food. Often the most affordable foods available in high quantities are cheap, processed foods high in fats and sugars and low in nutrition. There is a relationship between eating low quality food and obesity. This means there is possibly a link between food insecurity and obesity. Because obesity is increasing in the US, it is important to find relationships which could explain some of the causes of obesity. Below is my final infographic showing these two variables. Fig 1. Infographic...

Module 4: Color Concepts & Choropleth Mapping

Image
In this week's lab, I explored using color and selecting color ramps in ColorBrewer, as well as applying these concepts to create meaningful choropleth maps. I created a map of population change from 2010 to 2014 in Georgia counties. I normalized the data and produced a choropleth map of population change using a diverging color scheme with 6 classes divided around a midpoint of 0. Fig 1. Choropleth map of population change in Georgia counties using a diverging color scheme. For the Georgia population data set, I chose to divide the data set into 6 classes around a midpoint of 0: 3 showing a decrease in population and 3 showing an increase in the population. The classes were grouped based on a manual classification closely based on the Natural Break classification, where the midpoint was adjusted to 0 with the other groups unchanged. Natural Breaks classification creates classes based on similarities in values in the data, thereby revealing patterns in the data. By adjust...