Module 6: Damage Assessment
The purpose of this lab was to perform a post Hurricane Sandy damage assessment on structures within a study area in New Jersey. I began by performing a raster mosaic with pre- and post-Sandy imagery. With these mosaics added to a map, the Flicker and Swipe tools could be used to examine the structures pre- and post-Sandy.
I created a new point feature class for the damage assessment and created attribute domains for the analysis. Using domains helps assessments such as this one by ensuring data integrity because they limit value choices for each field. In addition, once the domains are created, a form can be created to use with ArcGIS Collector which is an app can be used in the field for a thorough damage assessment. Below is a screen capture of the domains I created with the Codes and Descriptions of the Structure Damage domain visible.


My analysis indicated that all buildings within 300 m of the coastline were at least “Affected” by the storm surge. Buildings within 100 m of the coastline were the most damaged, either destroyed or suffered major damage. Within 100-200 m of the coastline buildings suffered mostly minor damage, but some also suffered major damage, were destroyed or affected. Within 200-300 m all buildings were affected. Because there is a clear pattern in these results, the results from the study area could be reliably extrapolated to the rest of the coastline to make predictions about the structural damage of buildings within certain distances of the coastline.
I created a new point feature class for the damage assessment and created attribute domains for the analysis. Using domains helps assessments such as this one by ensuring data integrity because they limit value choices for each field. In addition, once the domains are created, a form can be created to use with ArcGIS Collector which is an app can be used in the field for a thorough damage assessment. Below is a screen capture of the domains I created with the Codes and Descriptions of the Structure Damage domain visible.

I then performed my damage assessment by locating and identifying attributes based on storm damage. I zoomed into the Ocean County
Parcels and used the Swipe tool to compare the pre-Sandy imagery to the post-Sandy
imagery for each parcel. A large scale (1:500) with a small geographic extent
worked best for identifying damage to structures in each parcel. The decisions
that were most difficult to make were for properties furthest from the storm surge
that looked intact but would obviously have some impact from the storm surge inundation.
These were labeled affected, but would definitely need further evaluation as
the damage is most likely not visible from the imagery. It was also difficult
to make any assessment about wind damage on the structures in the Damage
Assessment Study Area as all the roofs were intact. Actual pictures of the
structures would be helpful to assess the extent of the damage. DEMs or other
elevation information might also be helpful in evaluating damage, as it would
reveal the extent of erosion or accretion in the area from the storm surge,
which would reveal more about the extent of damage to structures.
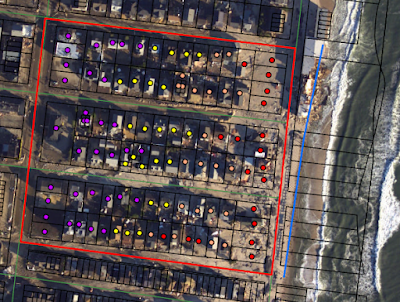
Below is a screen capture of my
damage assessment results, showing all the points I created, symbolized by the
level of structural damage.


I then examined the locations of the damaged properties relative to the coastline. I created a new line feature class of the coastline (the blue line in the screen shot above) for this part of the analysis. I used the Select
Layer by Location tool with the following parameters: Input features (Structure
Damage feature class), Relationship (within distance), Selecting Features
(Coastline feature class), Search Distance (distances in table: 100 m, 200 m,
and 300 m), and Save selection as feature. Because the feature classes for 200
m and 300 m also included all structures within that distance, and I only needed structures within 100-200 m and 200-300 m, I used the Select
by Location tool on each of these new feature classes to delete features within
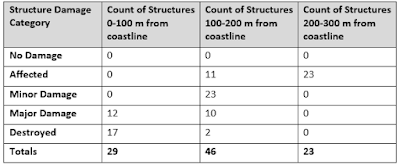
100 m & 200 m, in each feature class respectively. I used the attribute tables of each of the new feature
classes and organized by structure damage category to get the counts of the
structures within each damage category. Below is a table of the results of my analysis.

My analysis indicated that all buildings within 300 m of the coastline were at least “Affected” by the storm surge. Buildings within 100 m of the coastline were the most damaged, either destroyed or suffered major damage. Within 100-200 m of the coastline buildings suffered mostly minor damage, but some also suffered major damage, were destroyed or affected. Within 200-300 m all buildings were affected. Because there is a clear pattern in these results, the results from the study area could be reliably extrapolated to the rest of the coastline to make predictions about the structural damage of buildings within certain distances of the coastline.


Comments
Post a Comment