Module 2.2: Surface Interpolation
In this week's lab, I investigated different surface interpolation techniques using ArcGIS Pro including Thiessen, Inverse Distance Weighted (IDW) and Spline (Regularized and Tension). Each
interpolation technique has its advantages and disadvantages and choosing which
to use is dependent on the type, number and purpose of the data being used in
the analysis.
For this analysis, I used a data set of water quality samples taken in Tampa Bay, focusing on Biochemical Oxygen Demand (BOD) in milligrams per liter.
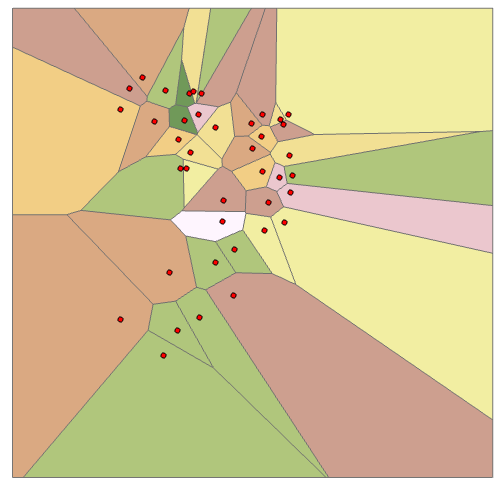
The first technique I explored was the Thiessen technique. This interpolation technique assigns an interpolated value equal to the value found at the nearest sample point. It is widely used because it is easy to create, use and interpret. In fact, no GIS software is required for the creation of the polygons. The results in this lab analysis indicate that the statistics generated from the Thiessen technique are almost the same as non-spatial techniques. However, the Thiessen technique creates a series of polygons with oddly shaped boundaries and abrupt transitions as seen in the image below. The resulting surface may not show well defined boundaries of a specific area. In fact, in this lab, the resulting surface was square, which is not representative of the boundary of the sample area and would have to be clipped to the area of study for a map. This technique would not be suitable for continuous variables as gradual changes in data would not be represented.


The second technique was the Inverse Distance Weighted or IDW. In this technique, the sampling point has a local influence that diminishes with distance, meaning that points closer together are weighted more than those further away. IDW assumes that points closer together will have the same value than those further away. The image below is the IDW interpolation for the same Tampa Bay water quality data.


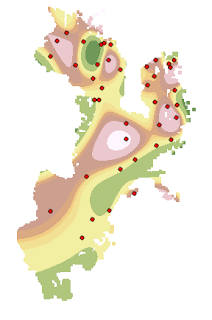
The final technique was the Spline. This technique uses polynomial functions to minimize the surface curvature, resulting in a surface that passes exactly through the input points. In this analysis, I used both regularized and tension spline analyses. Both the regularized and tension techniques use the same calculation principle to derive the surface area, but the tension method is more restrictive and keeps the values closer to the original point. The images below show the Spline interpolations using the regularized (top) and tension (bottom) techniques for the same Tampa Bay water quality data.


For this analysis, I used a data set of water quality samples taken in Tampa Bay, focusing on Biochemical Oxygen Demand (BOD) in milligrams per liter.
The first technique I explored was the Thiessen technique. This interpolation technique assigns an interpolated value equal to the value found at the nearest sample point. It is widely used because it is easy to create, use and interpret. In fact, no GIS software is required for the creation of the polygons. The results in this lab analysis indicate that the statistics generated from the Thiessen technique are almost the same as non-spatial techniques. However, the Thiessen technique creates a series of polygons with oddly shaped boundaries and abrupt transitions as seen in the image below. The resulting surface may not show well defined boundaries of a specific area. In fact, in this lab, the resulting surface was square, which is not representative of the boundary of the sample area and would have to be clipped to the area of study for a map. This technique would not be suitable for continuous variables as gradual changes in data would not be represented.


Spline - Regularized


Spline - Tension


Comments
Post a Comment