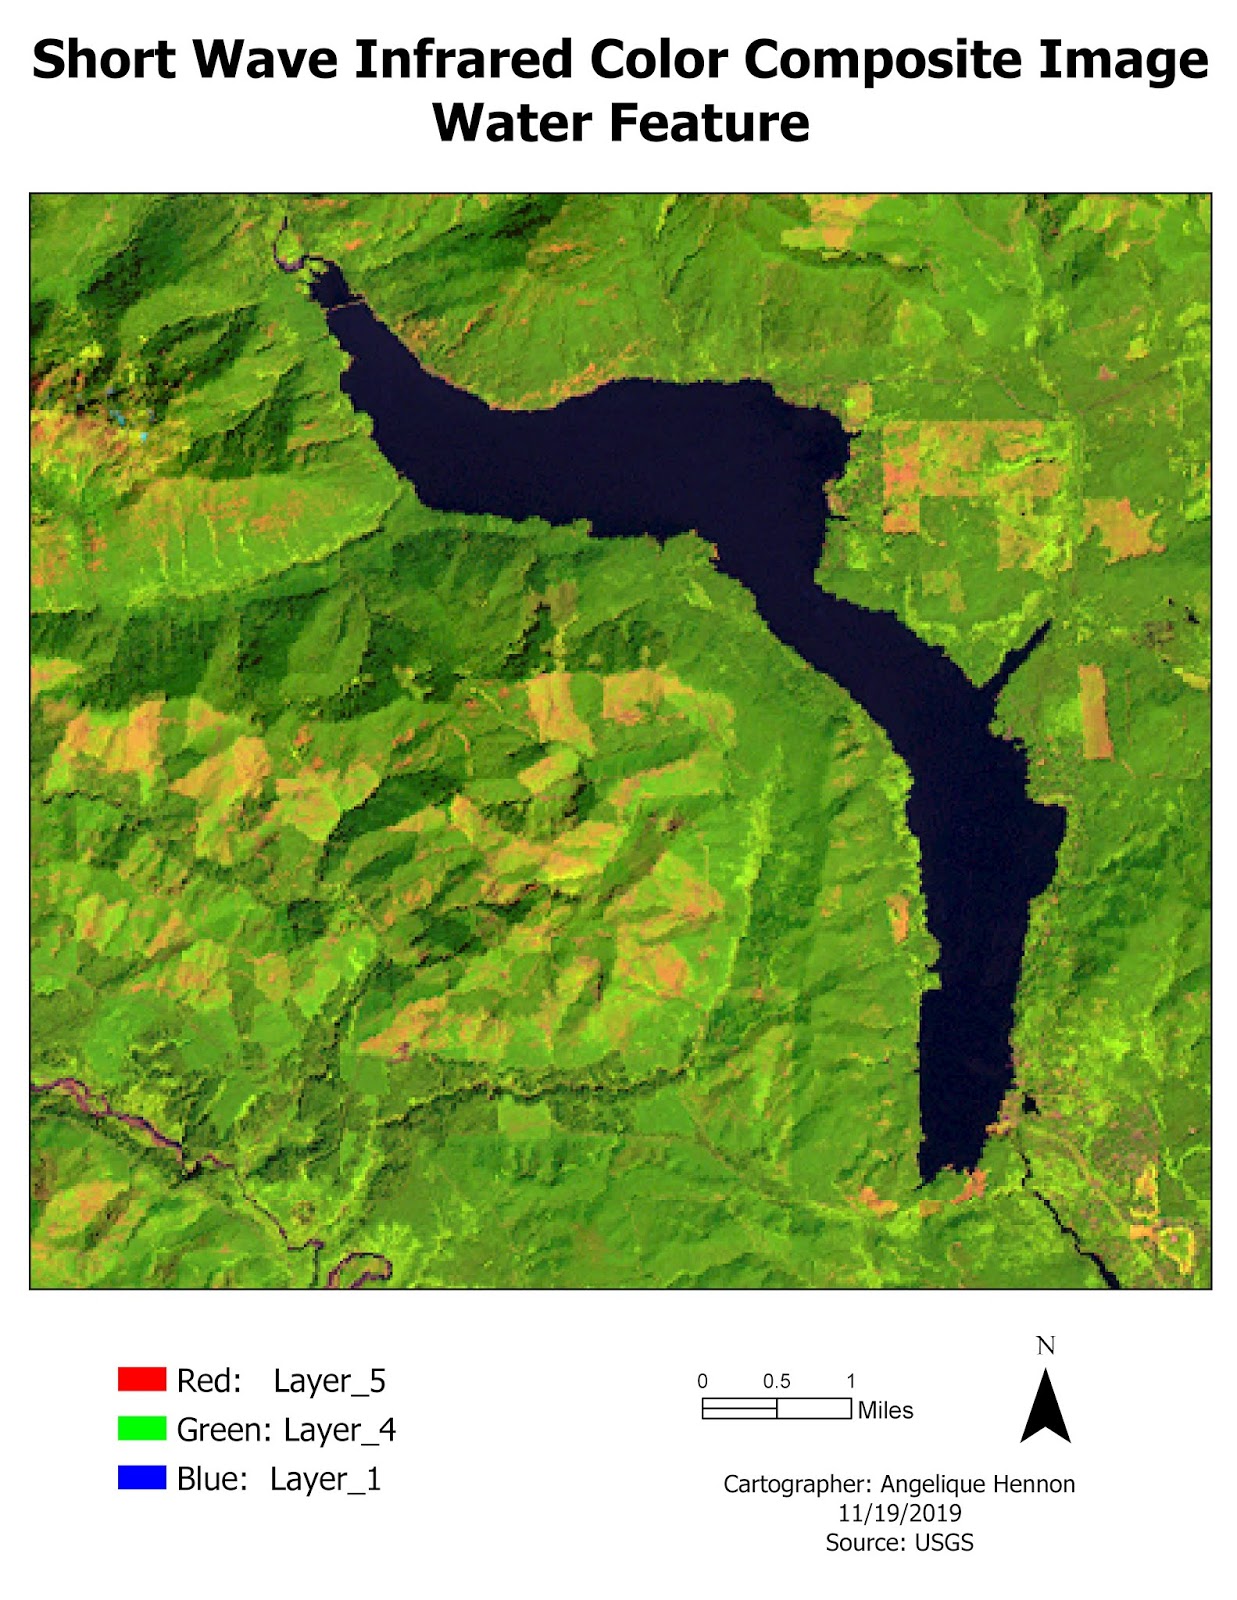
The deliverables for this lab included identifying three features from pixel descriptions on an image in ERDAS Imagine. Grayscale and Multispectral versions of the image were examined using layer histograms and the Inquire Cursor. Once the feature was identified, the Create Subset tool was used to create an image of the area to import into ArcGIS Pro to create the maps. A different multispectral band combination was used for each feature mapped to make that feature stand out. The maps below show each of the features identified in the lab.
 |
| The water features in the image produced a spike between pixel values of 12 to 18 in Layer_4. To make the feature stand out and identifiable as blue water, Short Wave Infrared Color Composite band combination was selected where dark blue is water, green is vegetation and pink is bare soil. |
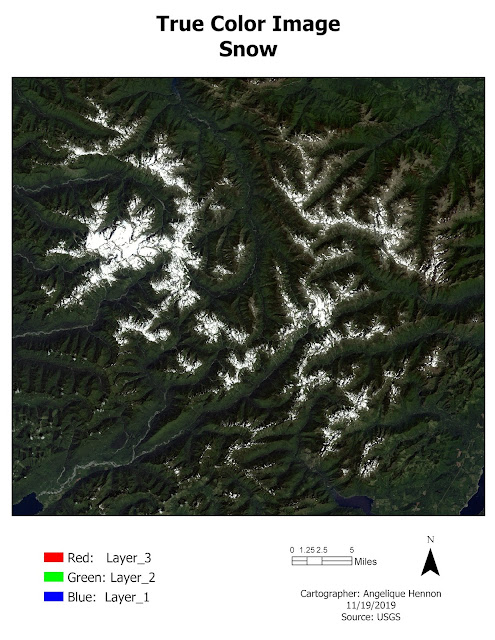 |
| The snow in the image produced both a small spike around pixel value 200 in Layers 1-4 and a large spike between pixel values 9 and 11 in Layers 5-6. To make the feature stand out and identifiable as white snow, True Color band combination was selected where white is snow, dark blue is water, green is vegetation and brown is bare soil. |
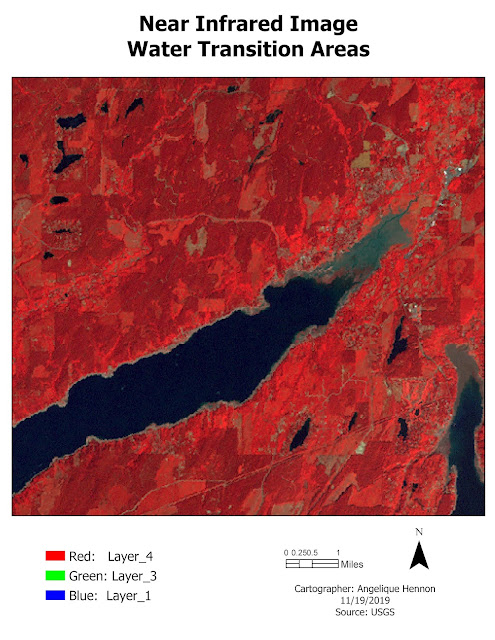 |
| Areas where water features transition and converge produced brighter than normal pixel values in Layers 1-3, somewhat brighter than normal pixel values in Layer_4 and normal pixel values in Layers 5-6. To make these areas stand out and identifiable as water with variations of blue, Near Infrared band combination was selected where variations of blue is water, red is vegetation and bare soil and urban areas are greenish-brown. |


Comments
Post a Comment