Lab 7 - Data Search


The purpose of this lab was to search for and select GIS data from multiple sources and create easy to interpret maps with the data for an assigned county in Florida. I was assigned Gulf County. The GIS data required for this lab was 1 Digital Orthographic Quarter Quadrangle (DOQQ) aerial, 1 Digital Elevation Model (DEM), 5 vector files representing the county boundary, cities & towns, roads, public lands, surface water (lakes and rivers), and 2 of 4 environmental vector files (I chose wetlands and invasive species). I found all vector files and the DEM by searching the Florida Geographic Data Library (FGDL). I found the DOQQ by searching for a quad in Gulf County under the aerial images section. The most difficult single layer to find was one for surface water. It was difficult to find one layer that showed both major rivers and lakes in Gulf County. Instead, I found and used 3 layers that accomplished this and looked the best on my maps.
Because all of the files were in the Albers projection, with the exception of the DOQQ (which was in NAD1983 State Plane), I elected to use the Albers projection for my maps, remembering to add the DOQQ to the map frame last so that ArcGIS Pro projected it to Albers. I manipulated my data and created all my maps using ArcGIS Pro.
I isolated Gulf County from a data layer that contained all Florida counties by using "Select by Attribute" and "Make Layer from Selected Features." I then exported this as a new Shapefile.
With the exception of the DOQQ, all the layers were for the entire state of Florida. In order to narrow the vectors layers to the extent of Gulf County, I used the Clip(Analysis) tool. The Input Feature was always the vector layer and the Clip Feature was always Gulf County. In order to narrow the DEM file to the extent of Gulf County, I used the Clip(Data Management) tool. The Input Raster was the DEM, the Output Extent was Gulf County and I had to check "Use Input Features for Clipping Geometry."
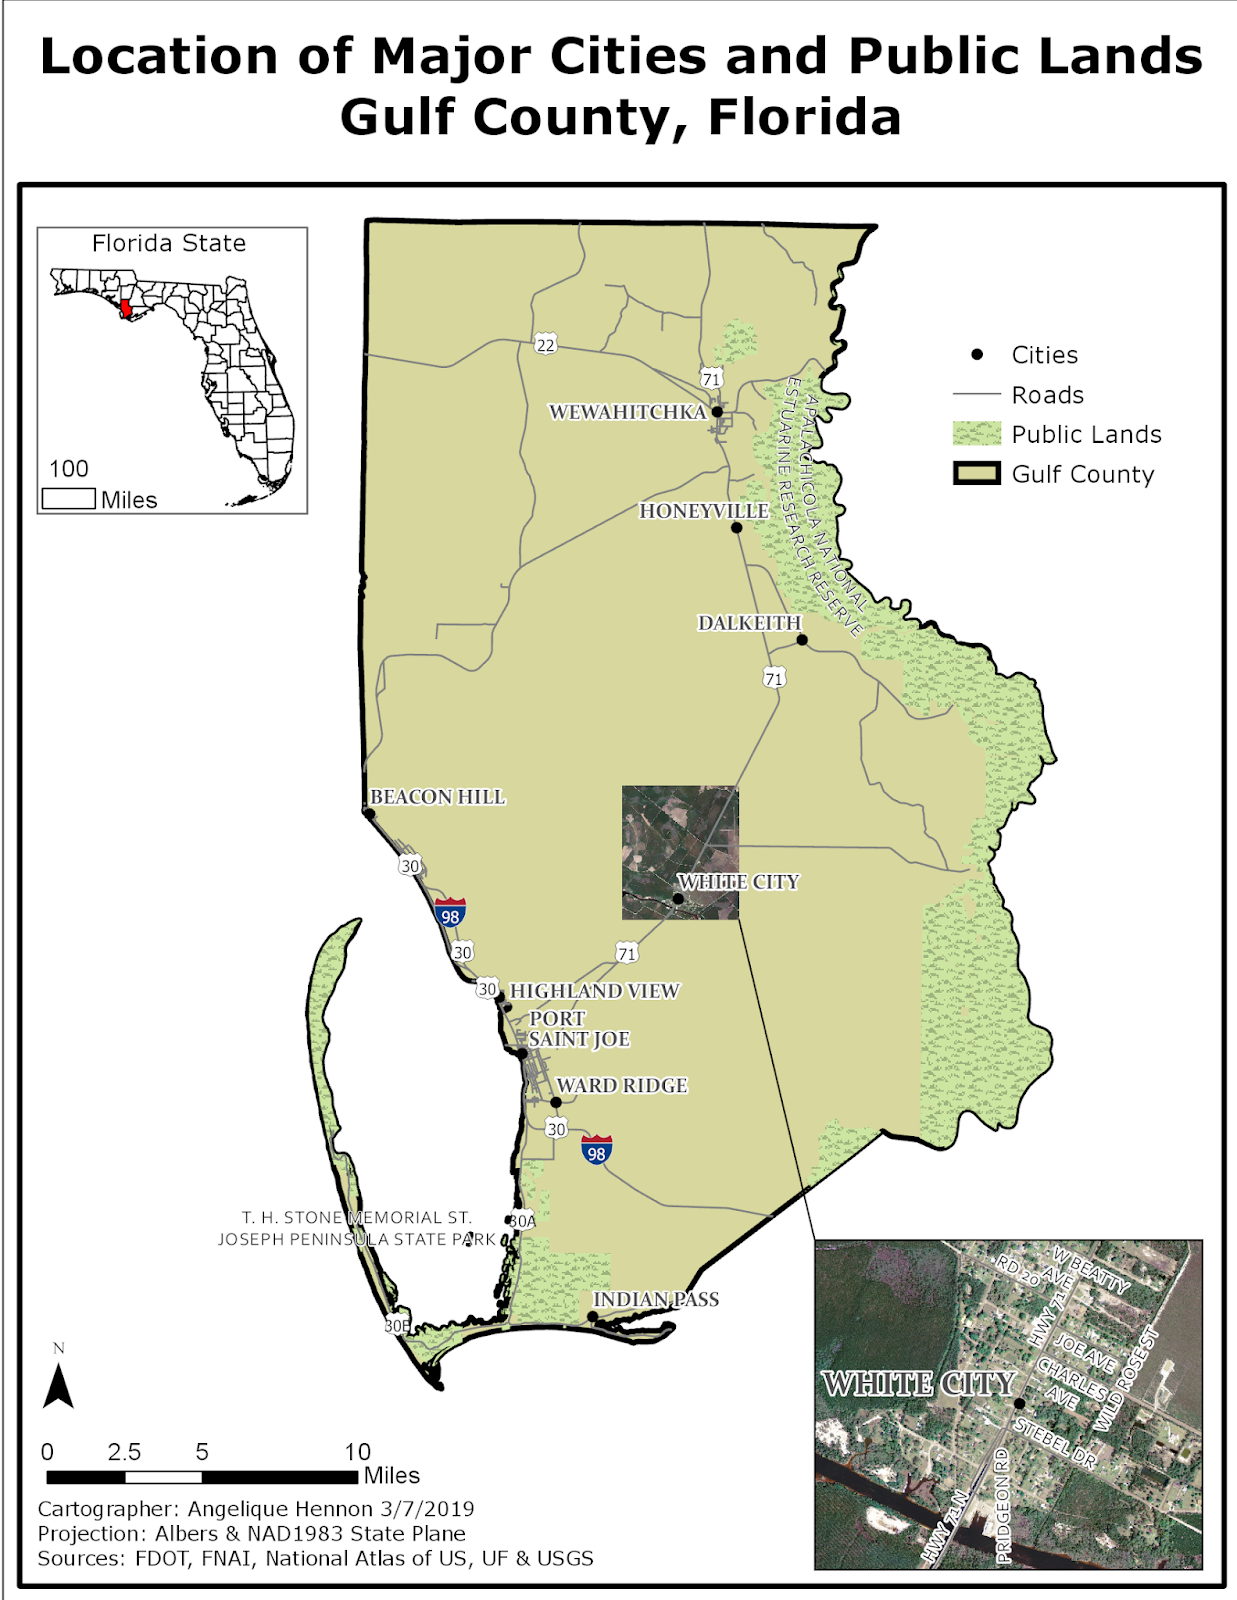
Because of the types of data layers and their logical pairing, I elected to create 3 maps with the data layers I found. It made the most sense to combine the county boundary, cities, roads, public lands and aerial on one map to serve as a location map. Because the purpose of this map is to locate major features and navigate within the county, I used an inset map of the state to show Gulf County's location in the state and inserted an enlarged inset map of the city and roads in the aerial. I chose to label the cities, major roads and public lands. It also made sense to combine the DEM with the surface water features as elevation is often related to location of water. I chose to label the two major lakes in the county on this map. Finally, it made sense to combine the wetlands and invasive species on one map, and include the county boundary as background reference. Because there was a portion of the map where the invasive species were crowded, I chose to enlarge the area and create an inset map of the area. I wanted to use the map to identify the type invasive species of plants near wetlands, so I used Unique Value symbology to symbolize each species of plant.


Comments
Post a Comment